How do we make decisions? Depending on the size of the company or program, that answer tends to be very involved. Turning the question on me, I would reply with a number of different metrics: Cost, Political issues, technical worthiness, and so on… The problem is that none of these options are equally weighted. What I also find is that – depending on the day – those metrics change! Call it a bad memory, a bad day, or what-have-you, but it’s true and I’m not the only one.
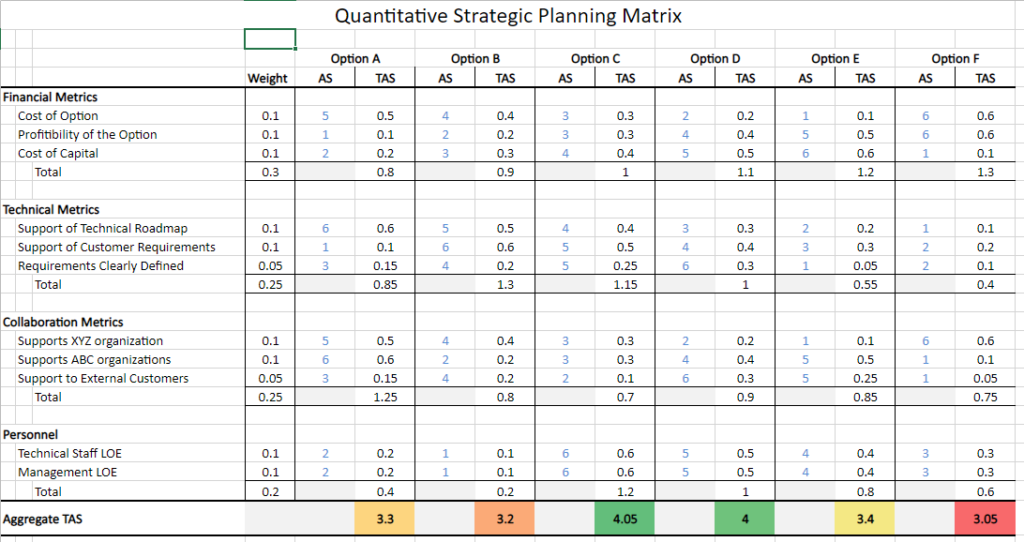
One of the more valuable strategic management tools I’ve found is called the Quantitative Strategic Planning Matrix (QSPM). The QSPM is a quantitative tool which allows several options (strategies, proposals, whitepapers, etc) to be ranked on various weighted metrics. We will reference the following QSPM template in the explanation:

Step 1: Define the Metrics
In the left column you’ll notice a list of common metrics by which we’ll judge all our options. The first step is obviously defining these metrics. If you’re lucky enough to be the single decision maker, you can take some time for reflection and really think about what your decisions consist of. However, you’re likely going to be working on this with a committee, which may be a challenge. (Getting people to work together is beyond the scope of this post!)
Step 2: Weigh the Metrics
Each decision you make is a 100% decision. You can’t make a half decision or a 90% decision. When you make a decision, it is always 100%. This is the purpose of the Weight column. In step 2, you will weigh each metric relative to each other. When you’re done, these weights should total 100%. For example: if I only have 3 metrics: Personnel Required, Cost, and ROI, I might choose to weight these metrics 20%,30%,50% respectivley. This says that half of my decision is based on ROI, 30% is Cost, and the remaining 20% is the Level of Effort. (notice these add up to 100%). In my QSPM template, you will be warned if you exceed 100%
Step 3: Rate your Options
You now know your metrics and how important they are in making a decision. It’s now time to begin rating your options based on these metrics. You’ll notice two columns under each option: Attractiveness Score (AS) and Total Attractiveness Score (TAS). The AS is a ranking of each option based on a single metric. In the sample spreadsheet, you’ll notice that for the “Cost of Option” metric, Option E is much more attractive that Option F. (Note: you cannot duplicate AS numbers in each row. There is no tie! Aske the question “If I can only do one option based on this metric, what would it be?”).
When you’ve completed all the AS rankings for each option and each metric, the spreadsheet will weigh each AS score into the TAS column. This is simply the product of the AS of the option and the weight of the metric.
Step 4: Analyze the Results
At the bottom of the QSPM you will total your TAS numbers for each option. The hightest value is the most attractive decision to make based on all you weighted metrics! But be cautious… Small differences between options may not justify a rational decision! If the differences are .05, for example, you have noted that GIVEN THE CURRENT WEIGHTING one option is marginally better than the other. At this point you may want to reevaluate the weights or potentially add/remove metrics.
Final Notes:
Is this the one-and-only way to make decisions? Certainly not. Some decisions must be made right away and leave little time for analysis. But if you have the time, it’s certainly worth it. But…Be Prepared…Some of the interesting things you may find include: 1) You’ve made some bad choices 2) You’re not entirely sure what constitutes your decision making metrics 3) You’re not sure metrics are more important than others 4) probably more!
As with all planning and strategic management, it is ESSENTIAL to revisit the QSPM when options are added/removed, when your environment changes and alters your metrics (or scale), or as your opinion of each option changes. Strategic management is not a static process!